หน้าแรกของ IC Markets เข้าสู่ระบบ เว็บเทรดเดอร์ ติดต่อเรา
IC Markets Social IC Markets Social

Information Hub for
Serious Traders

  • เกี่ยวกับเรา
  • เปิดบัญชีเทรด
  • เปิดบัญชีเดโม่
  • เริ่มเทรด
  • เยี่ยมชมบล็อกของเรา
IC Markets Social
  • เกี่ยวกับเรา
  • เปิดบัญชีเทรด
  • เปิดบัญชีเดโม่
  • เริ่มเทรด
  • เยี่ยมชมบล็อกของเรา
February 24, 2021European_Indexes_enIC Markets

Either a rebound or a breakout imminent on France 40 Index

France 40 Index is heading towards a line of 5803.7998. If this movement continues, we expect the price of France 40 Index to test 5803.7998 within the next 21 hours. But don’t be so quick to trade, it has tested this line numerous times in the past, so this movement could be short-lived and end […]

Read more
February 22, 2021European_Indexes_enIC Markets

Either a rebound or a breakout imminent on Germany 30 Index

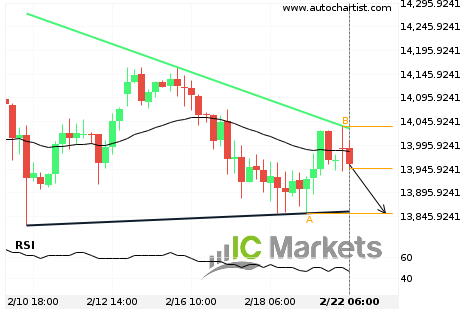
Germany 30 Index is heading towards the support line of a Descending Triangle. If this movement continues, we expect the price of Germany 30 Index to test 13852.5000 within the next 3 days. But don’t be so quick to trade, it has tested this line numerous times in the past, so this movement could be […]

Read more
February 19, 2021European_Indexes_enIC Markets

Should we expect a breakout or a rebound on Germany 30 Index?

The movement of Germany 30 Index towards 13946.2002 price line is yet another test of the line it reached numerous times in the past. We expect this line test to happen in the next 8 hours, but it is uncertain whether it will result in a breakout through this line, or simply rebound back to […]

Read more
February 18, 2021European_Indexes_enIC Markets

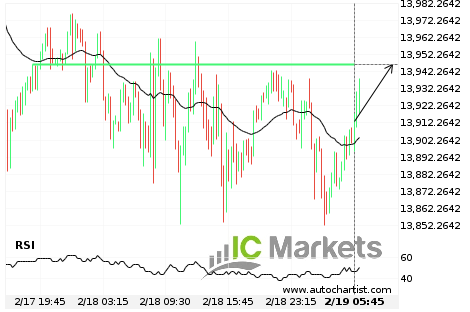
Will Germany 30 Index have enough momentum to break support?

Germany 30 Index is heading towards the support line of a Channel Down and could reach this point within the next 7 hours. It has tested this line numerous times in the past, and this time could be no different from the past, ending in a rebound instead of a breakout. If the breakout doesn’t […]

Read more
February 17, 2021European_Indexes_enIC Markets

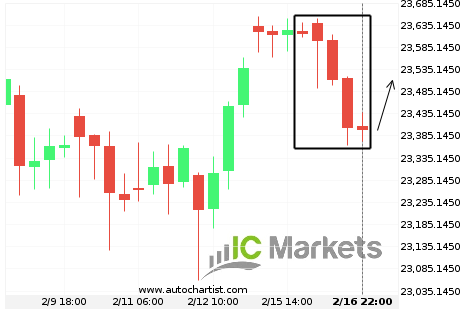
Where is Italy 40 Index moving to?

After posting 5 consecutive bearish candles in 2 days, you may start considering where Italy 40 Index is heading next, a continuation of the current downward trend, or a reversal in the previous direction.

Read more
February 16, 2021European_Indexes_enIC Markets

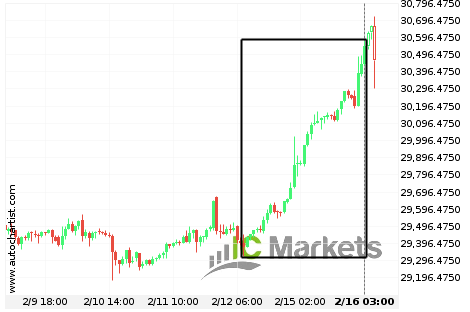
What’s going on with Japan 225 Index?

Those of you that are trend followers are probably eagerly watching Japan 225 Index to see if its latest 3.99% move continues. If not, the mean-reversion people out there will be delighted to cash in on this exceptionally large 4 days move.

Read more
February 15, 2021European_Indexes_enIC Markets

UK 100 Index is on its way up

UK 100 Index has experienced an exceptionally large movement higher by 2.03% from 6,506.75 to 6,636.55 in the last 3 days.

Read more
February 12, 2021European_Indexes_enIC Markets

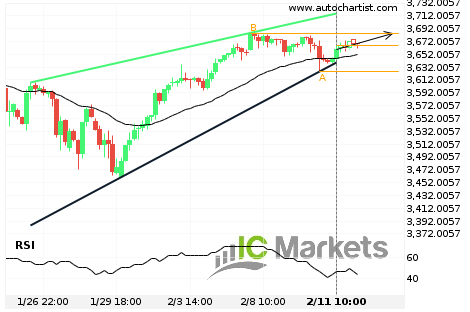
Breach of resistance line imminent by EU Stocks 50 Index

EU Stocks 50 Index is moving towards the resistance line of a Rising Wedge which it has tested numerous times in the past. We have seen it retrace from this line before, so at this stage it isn’t clear whether it will breach this line or rebound as it did before. If EU Stocks 50 […]

Read more
February 11, 2021European_Indexes_enIC Markets

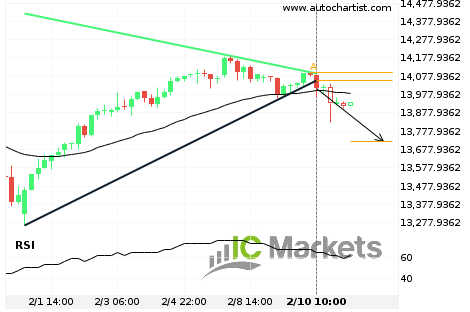
A start of a bearish trend on Germany 30 Index

Germany 30 Index has broken through a support line of a Triangle chart pattern. If this breakout holds true, we expect the price of Germany 30 Index to test 13719.6175 within the next 2 days. But don’t be so quick to trade, it has tested this line in the past, so you should probably confirm […]

Read more
February 10, 2021European_Indexes_enIC Markets

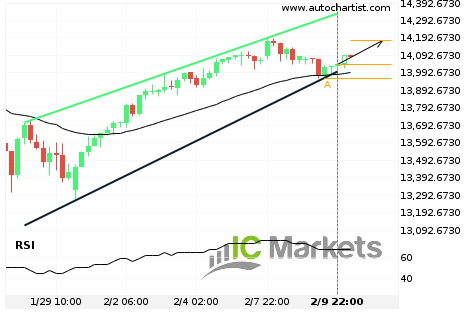
Breach of resistance line imminent by Germany 30 Index

Germany 30 Index is moving towards the resistance line of a Channel Up which it has tested numerous times in the past. We have seen it retrace from this line before, so at this stage it isn’t clear whether it will breach this line or rebound as it did before. If Germany 30 Index continues […]

Read more
  • 1
  • 2
  • 3
  • …
  • 10
  • 11
  • 12
  • 13
  • 14
  • 15
  • 16

Recent Posts

  • US Dollar vs Swiss Franc – ChartPattern – قناة صاعدة
  • Gold vs US Dollar- KeyLevel – แนวรับ
  • Gold vs Euroymbol – KeyLevel – แนวรับ
  • Gold vs Euro – KeyLevel – مقاومة
  • Gold vs Euro – KeyLevel – مقاومة

Recent Comments

    Translation


     Edit Translation

    เปิดบัญชีและฝากเงินได้แบบทันที

    เทรดได้ภายในไม่กี่นาที!

    เริ่มต้น ลองบัญชีเดโมได้ฟรี

    การเทรดฟอเร็กซ์

    • ภาพรวมของบัญชี
    • เปิดบัญชี
    • ใช้งาน Web Trader

    รายละเอียดของการซื้อขาย

    • สเปรดและค่าคอมมิชชั่น
    • ขอบเขตของตลาด
    • ช่วงเวลาซื้อขาย
    • การเพิ่มเงิน
    • การถอนเงิน

    เกี่ยวกับ IC Markets

    • Help Centre
    • ทำไมถึงต้องเป็น IC Markets
    • กฎระเบียบ
    • เอกสารทางกฎหมาย
    • ติดต่อเรา


    Forex Trading

    • Accounts Overview
    • Open an Account
    • Launch Web Trader

    Trading Specifications

    • Spreads and Commissions
    • Range of Market
    • Trading Hours
    • Funding
    • Withdrawal

    About IC Markets

    • Chat with a Specialist 24/7
    • Why IC Markets
    • Regulation
    • Legal Documents
    • ติดต่อเรา

    ข้อความจำกัดความรับผิดชอบ: เนื้อหาข้อมูลนี้เป็นเนื้อหาด้านการตลาดซึ่งได้ถูกเผยแพร่เพื่อวัตถุประสงค์ในการให้ข้อมูลเท่านั้น เนื้อหานี้ไม่ได้ประกอบไปด้วยและไม่ควรถือว่าประกอบไปด้วยคำแนะนำหรือการเสนอแนะด้านการลงทุน หรือการแนะนำให้มีการดำเนินการใดๆ กับตราสารทางการเงิน วิดเจ็ตที่แสดงอยู่ภายในเป็นของผู้จัดทำจากภายนอกและ IC Markets ไม่มีส่วนรับผิดชอบใดๆ เกี่ยวกับเนื้อหาและผลกระทบที่มีต่อการเทรด

    สงวนลิขสิทธิ์สำหรับเนื้อหาทั้งหมด ความคิดเห็นของผู้จัดทำอาจไม่สอดคล้องกับความคิดเห็นของผู้จัดทำบล็อก เมื่อมีการคัดลอกเนื้อหาจากเว็บไซต์นี้หรือมีการเชื่อมโยงไปยังฟีด RSS เพื่อเผยแพร่บทความของเรา ผู้ที่ทำการคัดลอกจะต้องใส่ลิงก์ไปยัง IC Markets หรือมีการระบุแหล่งที่มาในรูปแบบ ‘IC Markets Blog’ สำหรับคำถามโดยทั่วไปโปรดติดต่อสำนักงานบรรณาธิการผ่านทางแบบฟอร์มบนหน้าติดต่อเรา

    คำเตือนเกี่ยวกับความเสี่ยง: การเทรดตราสารอนุพันธ์มีความเสี่ยงในระดับสูงกับเงินทุนของคุณและคุณควรทำการเทรดด้วยเงินที่คุณ สามารถรับการขาดทุนได้เท่านั้น การเทรดตราสารอนุพันธ์อาจไม่เหมาะกับนักลงทุนทุกท่าน ดังนั้นโปรดทำความเข้าใจกับความเสี่ยงที่เกี่ยวข้องและหาคำแนะนำที่เป็นอิสระหากจำเป็น นักลงทุนควรศึกษา Product Disclosure Statement (PDS) ก่อนทำธุรกรรมใดๆ กับเรา

    เนื้อหาข้อมูลที่ถูกแสดงอยู่บนหน้านี้เป็นข้อมูลโดยทั่วไปเท่านั้นและไม่ได้มีการคำนึงถึงสถานการณ์ส่วน ตัวของคุณ, เป้าหมายทางการเงิน หรือความต้องการของคุณ คุณเป็นผู้พิจารณาว่าผลิตภัณฑ์ต่างๆ ที่เรามีให้บริการเหล่านี้ตรงกับความต้องการของคุณหรือไม่ อีกทั้งคุณไม่ควรทำการเทรดกับเราจนกว่าคุณจะเข้าใจถึงคุณสมบัติและความเสี่ยงที่เกี่ยวข้องกับผลิตภั ณฑ์ที่เรามีให้บริการ นั่นหมายความว่าคุณอาจต้องการคำแนะนำที่เป็นอิสระก่อนที่คุณจะเริ่มต้นเทรดกับเรา

    © 2022 Raw Trading Ltd | All rights reserved.
    • Sample Page